Client-side telemetry: Setting up a new CDK project
All the setup needed to write and deploy a new CDK project.

Graeme Zinck
Feb 9, 2025
Senior software engineer at Lazer Technologies
4 min read
This is the 2nd article in a 5-part series:
Rolling your own client-side telemetry solution using AWS CDK
A step-by-step walkthrough on deploying a client-side telemetry stack using AWS CDK, Lambda, API Gateway, and CloudWatch.
- Client-side telemetry: Series overview
- Client-side telemetry: Setting up a new CDK project
- Client-side telemetry: Deploying a Typescript Lambda function with CDK
- Client-side telemetry: Lambda permissions and APIs in CDK
- Client-side telemetry: Alarms
In the last article, we went over the game plan for building a client-side telemetry solution. Now, we'll dive in, set up, and deploy a new AWS CDK project.
What's so great about AWS CDK?
The AWS console is great for exploring products with AWS hand-holding you along the way. It's also a really convenient place to see your existing resources. However, if you have multiple environments or you're worried an intern will accidentally torch your database if their changes don't go through code review, there are better options.
One alternative is to write a Cloudformation template. The template represents all the resources you want to create, and you can parameterize it for different environments. Brilliant!
Unfortunately, Cloudformation templates suck. First off, they're really hard to use. Autocomplete isn't supported without special utilities and it's exceptionally difficult to organize your yaml files in a way that makes it easy to read and modify. It's also very verbose: there aren't many shortcuts to quickly set up common resources like autoscaling. You could use nested Cloudformation stacks, but that has its own challenges.
That's where AWS CDK comes in. You can write Typescript code seamlessly with
your basic autocomplete IDE tools. Everything gets checked at compile time.
Permissions (sometimes) get added implicitly. And you can organize your code
into folders that all compile down into a Cloudformation template that's
automatically deployed with a single npx cdk deploy command. It's ✨ magic! ✨
Let's write some CDK code!
Setting up your repository
Pre-requisites
- Make sure you have the latest version of Node installed. (I'd recommend using nvm.)
- Set up a domain with AWS Route 53.
- Install
cdkand authenticate with your AWS account credentials.
Setting up boilerplate
We'll start by creating a new CDK application. Navigate to where you want to create your app and run:
mkdir infra-fe-telemetry
cd infra-fe-telemetry
npx cdk init app --language typescript
Before writing any code, we can set up a few linting and formatting tools to ensure our code is beautiful ✨
We'll use prettier for formatting, eslint for linting, and lint-staged and
husky to automatically run linting before every commit.
npm i -D eslint @eslint/js @types/eslint__js typescript-eslint lint-staged prettier husky
npx husky init
To set everything up, we'll need some config files:
// prettier.config.js
// To set up some standard formatting rules
module.exports = {
  singleQuote: true,
  trailingComma: "es5",
  useTabs: true,
};

// eslint.config.mjs
// To configure our linter to use typescript
// @ts-check
import eslint from "@eslint/js";
import tseslint from "typescript-eslint";

export default tseslint.config(
  eslint.configs.recommended,
  ...tseslint.configs.recommended,
);

// lint-staged.config.js
// To configure lint-staged to run linting and formatting on staged files
module.exports = {
  "**/!(*config).(js|ts)": (filenames) => [
    `eslint --fix ${filenames.join(" ")}`,
    `git add ${filenames.join(" ")}`,
  ],
  "**/*.(js|ts|json|md)": (filenames) => [
    `prettier --write ${filenames.join(" ")}`,
    `git add ${filenames.join(" ")}`,
  ],
};
We can automatically run linting before every git commit with this husky
config:
# .husky/pre-commit
npx lint-staged
Folder structure
This is how we're going to lay out our code:
lib/The home for all our AWS resources.constructs/*The organized collections of resources, or "Constructs", we want to instantiate.infra-fe-telemetry-stack.tsThe stack that puts all the constructs together.
bin/The place we define all the envs to set up our stacks.infra-fe-telemetry.tsThe "main" file of the CDK application.
lambda/A folder of independent Typescript packages that we want to run on AWS Lambda.error-logger/*A simple Typescript package that handles requests and dumps logs into AWS CloudWatch.
scripts/*Build scripts for compiling the Typescript packages
Creating a minimal Typescript deployment
We'll start with some basic setup.
// lib/infra-fe-telemetry-stack.ts
import * as cdk from "aws-cdk-lib";
import { Construct } from "constructs";

export interface InfraFETelemetryStackProps extends cdk.StackProps {
  /** The domain name for the platform (e.g., "example.com") */
  readonly domainName: string;
  /** The subdomain for hosting the telemetry service (e.g., "telemetry") */
  readonly subdomain?: string;
  /** The environment for the telemetry stack. Used for naming resources. */
  readonly environment?: string;
  /** Telemetry service name (unique across AWS account). Used for naming resources. */
  readonly serviceName?: string;
}

export class InfraFETelemetryStack extends cdk.Stack {
  constructor(
    scope: Construct,
    id: string,
    {
      domainName,
      subdomain = "fe-telemetry",
      environment = "production",
      serviceName = "fe-telemetry",
      ...props
    }: InfraFETelemetryStackProps,
  ) {
    super(scope, id, props);
  }
}
This allows our stack to be generic and deployed multiple times to different envs. Each env will have a different subdomain (or domain) and a different "environment" for naming resources.
Adding CloudWatch Logs
Now, we'll add our first resource! In this series, we're making an error logger, so we'll need a log stream and log group to put errors in CloudWatch.
// lib/infra-fe-telemetry-stack.ts

import * as logs from "aws-cdk-lib/aws-logs";

const LOG_STREAM_NAME = "lambda-logs";

// export class InfraFETelemetryStack extends cdk.Stack {
//   constructor() {
//     ...
       const logGroup = new logs.LogGroup(this, "LogGroup", {
         logGroupName: `${serviceName}-${environment}`,
         removalPolicy: cdk.RemovalPolicy.DESTROY,
         retention: logs.RetentionDays.ONE_MONTH,
       });

       new logs.LogStream(this, "LogStream", {
         logGroup,
         logStreamName: LOG_STREAM_NAME,
       });
//   }
// }
This sets up log storage for up to one month, but you can store logs for longer. If you're confused about the removal policy, you can learn more here.
Setting up an environment
Now, we can set up our first environment! In the following code, replace the domain with your own.
// bin/infra-fe-telemetry.ts
//
// NOTE: the following stack would create the service at domain
//       https://fe-telemetry.local.my-domain-name.com
//       Replace it with your domain!

import "source-map-support/register";
import * as cdk from "aws-cdk-lib";
import { InfraFETelemetryStack } from "../lib/infra-fe-telemetry-stack";

const app = new cdk.App();
const localStack = new InfraFETelemetryStack(app, "FETelemetryLocal", {
  env: {
    account: process.env.CDK_DEFAULT_ACCOUNT,
    region: process.env.CDK_DEFAULT_REGION,
  },
  domainName: "my-domain-name.com",
  subdomain: "fe-telemetry.local",
  environment: "local",
  serviceName: "fe-telemetry-service",
});
We're all set! Run npx cdk bootstrap && npx cdk deploy to deploy your stack.
You can see the result on the AWS console.
https://{REGION-CODE}.console.aws.amazon.com/cloudwatch/home#logsV2:log-groupsAdding tags for cost management
Now that we have something deployed, we'll probably want to know how much we're going to be charged. AWS Billing and Cost Management allows you to view the cost per day for resources, but it can be difficult to determine which resources are associated with which service. One easy way to attribute resources to a particular service and environment is using tags.
In this project, we're going to add service and environment tags to our
resources.
// bin/infra-fe-telemetry.ts

const app = new cdk.App();

// Apply 'service' tag to all resources in all stacks
cdk.Tags.of(app).add("service", "fe-telemetry-serv");

const localStack = new InfraFETelemetryStack(app, "FETelemetryLocal", {
  // ...
});

// Apply 'environment' tag to all resources in the localStack
cdk.Tags.of(localStack).add("environment", "local");
Now, we can run npx cdk deploy again and see the tags assigned to the
resource!
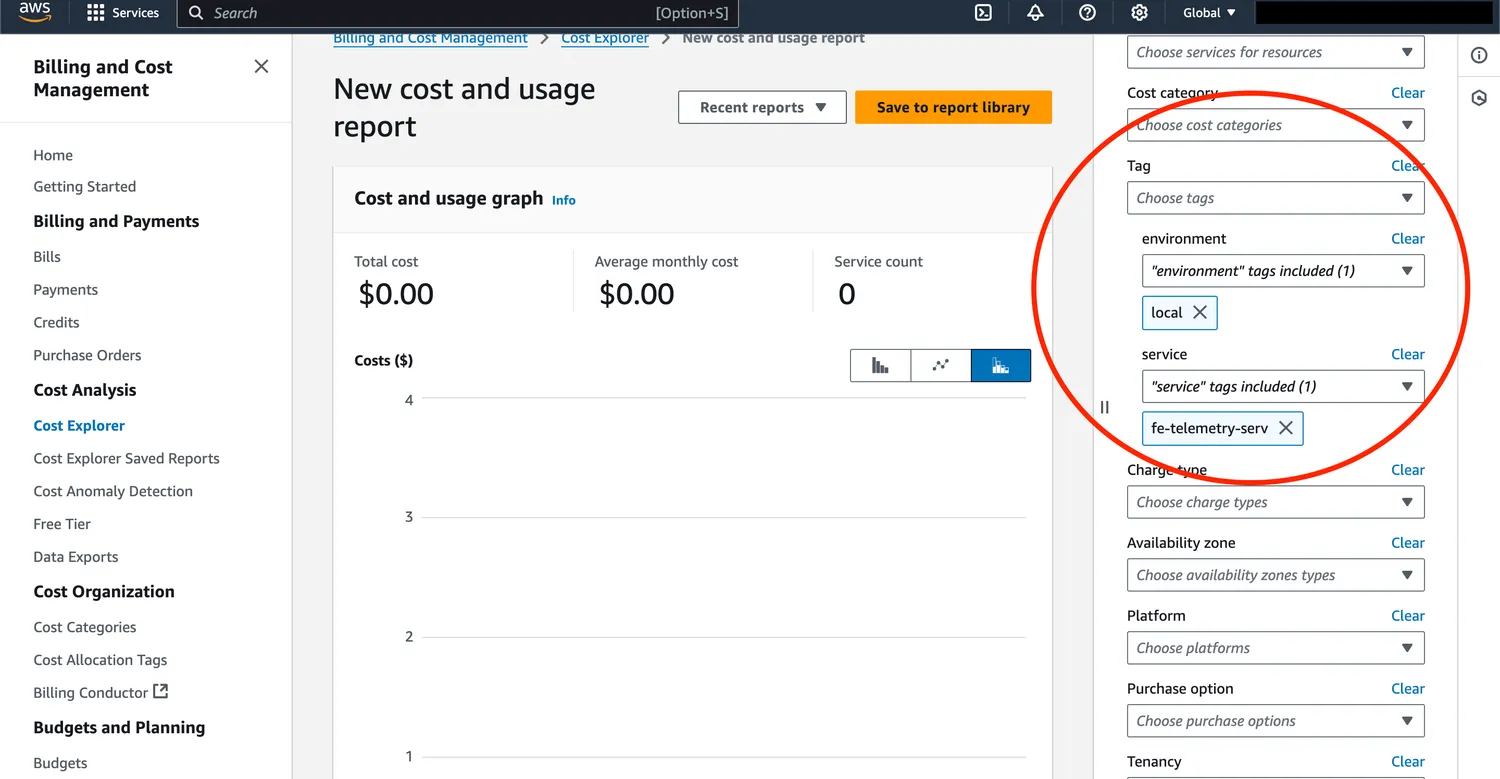
If we want to make cost reports based on tags, we'll have to enable the newly created "Cost Allocation Tags". We can enable them in the Cost Organization section of AWS Billing and Cost Management. Sometimes it takes a little while for our new tags to appear, so you might have to wait a day or two before this step becomes available!
You'll be able to filter on the tag in the Cost Explorer after the service has been running for a few days.
Now, we've finished the basic setup. In the next article, we'll configure a lambda function to send errors to our log group.
Keep reading in this series:
- Client-side telemetry: Series overview
- Client-side telemetry: Setting up a new CDK project
- Client-side telemetry: Deploying a Typescript Lambda function with CDK
- Client-side telemetry: Lambda permissions and APIs in CDK
- Client-side telemetry: Alarms